
Du Pont Control Chart
In the realm of modern quality management, the Du Pont Control Chart stands as an indispensable tool that enables organizations to monitor, analyze, and optimize various aspects of their processes. This innovative approach, akin to a navigational compass, guides businesses towards smoother operations, reduced inefficiencies, and heightened product or service quality. In this article, we delve into the intricacies of the Du Pont Control Chart, understanding its significance, creation, interpretation, and the transformative impact it can have on different industries.
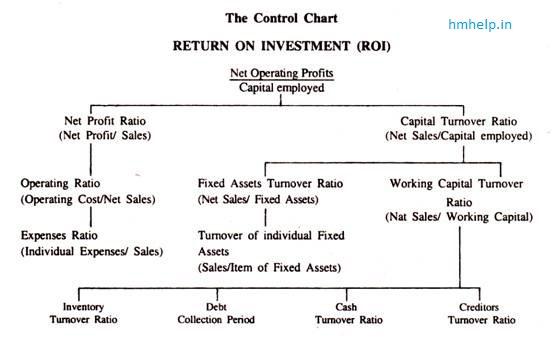
The Du Pont Control Chart is called as such because Du Pont Company of the USA first used it. The various factors affecting the Return on Investment (ROI) are illustrated through this chart. ROI represents the earning power of the business.
It depends on two ratios :–
(a) Net Profit ratio and
(b) Capital Turnover Ratio.
A change in any one of the two ratios will change the business earning power (i.e., ROI), and they are affected by many factors. The chart shown below exhibits that ROI is affected by a number of factors.
Any change in these factors will affect the return on capital employed. For example, if the cost of goods sold decreases without any corresponding decrease in selling price, the net profit will increase and therefore, ROI will also increase.
Similarly if there is decrease in working capital, the total capital employed will decrease and therefore, in the absence of any decrease in the net profit, ROI will decrease.
The Du Pont Chart helps management to identify the areas of problems, which affect profit, In other words, management can easily visualize the different forces affecting profits, and profits could be improved either by putting capital into effective use, which will result in higher turnover ratio, or by better sales efforts, which will result in higher profit ratio.
The same rate of return could be obtained either by a higher net profit ratio but low turnover ratio, or by a higher turnover ratio but a low net profit ratio.
Understanding the Du Pont Control Chart
Components of the Du Pont Control Chart
The Du Pont Control Chart amalgamates elements of statistical analysis and graphical representation, making it a versatile instrument for process monitoring. It consists of a central line representing the process mean, flanked by two control limits – the upper control limit (UCL) and the lower control limit (LCL).
Benefits of Implementing the Du Pont Control Chart
Organizations that embrace the Du Pont Control Chart unlock a plethora of advantages. Notably, it provides a clear visual representation of process stability and variation, allowing swift identification of anomalies. This proactive stance empowers businesses to mitigate potential defects and inefficiencies before they escalate.
Creating a Du Pont Control Chart
Data Collection and Preparation
The journey towards constructing a Du Pont Control Chart commences with meticulous data collection and preparation. Accurate, relevant, and comprehensive data forms the bedrock upon which the chart’s efficacy is built.
Plotting the Chart
With data in hand, the next step involves plotting the Du Pont Control Chart. This is a pivotal juncture, demanding precision and a keen eye for detail.
Setting Control Limits
The establishment of control limits requires a thorough grasp of statistical methods. These limits act as sentinels, guarding against normal variation and signaling when intervention is imperative.
Interpreting the Du Pont Control Chart
Identifying Common Causes and Special Causes
The Du Pont Control Chart serves as a discerning filter, helping organizations categorize variations into common causes or special causes. This differentiation is instrumental in determining whether process adjustments are necessary.
Analyzing Patterns and Trends
Patterns and trends that emerge from the chart offer invaluable insights. Sudden spikes or prolonged declines can unveil hidden issues or opportunities for enhancement.
Applications in Different Industries
Manufacturing
In the manufacturing realm, the Du Pont Control Chart can be wielded to optimize production processes, minimize defects, and bolster overall output quality.
Healthcare
Healthcare providers harness the chart’s power to enhance patient care, reduce medical errors, and fine-tune operational protocols.
Finance
Even in the intricate domain of finance, the Du Pont Control Chart plays a pivotal role in risk assessment, fraud detection, and portfolio management.
Enhancing Process Efficiency with Du Pont Control Chart
Streamlining Operations
Efficiency, the heartbeat of successful businesses, finds a staunch ally in the Du Pont Control Chart. By identifying bottlenecks and areas of inefficiency, organizations can streamline their operations and maximize resource utilization.
Waste Reduction
The chart’s ability to unveil variations helps in identifying wasteful practices and processes. By addressing these issues, businesses contribute to sustainability efforts while bolstering their bottom line.
Quality Management and Continuous Improvement
Integration with Six Sigma and Lean Principles
The Du Pont Control Chart seamlessly integrates with Six Sigma and Lean methodologies, intensifying the focus on quality management and continuous improvement.
Driving Organizational Excellence
Embracing the Du Pont Control Chart cultivates a culture of excellence. It encourages teams to strive for perfection while fostering a data-driven mindset.
Challenges and Considerations
Data Accuracy and Reliability
The accuracy of insights derived from the Du Pont Control Chart hinges on the accuracy and reliability of the input data. Organizations must prioritize data integrity to yield meaningful results.
Employee Training and Buy-In
Successful implementation demands employee training and buy-in. Ensuring that the workforce comprehends the chart’s nuances is pivotal for its effectiveness.
Du Pont Control Chart vs. Traditional Control Charts
While traditional control charts serve their purpose, the Du Pont Control Chart’s distinct ability to encompass multiple metrics sets it apart. This versatility amplifies its value in complex, multifaceted processes.
Future Trends and Innovations
As industries evolve, so too will the applications and features of the Du Pont Control Chart. Anticipate integration with advanced analytics and artificial intelligence, opening new frontiers of process optimization.
Also Check : Difference between profit maximization vs wealth maximization